2020 - 2021 Winter Outlook
I’m going to look at the following patterns to see if there is a correlation with this upcoming winter. The obvious one to start with is the La Nina. We are clearly in a La Nina.
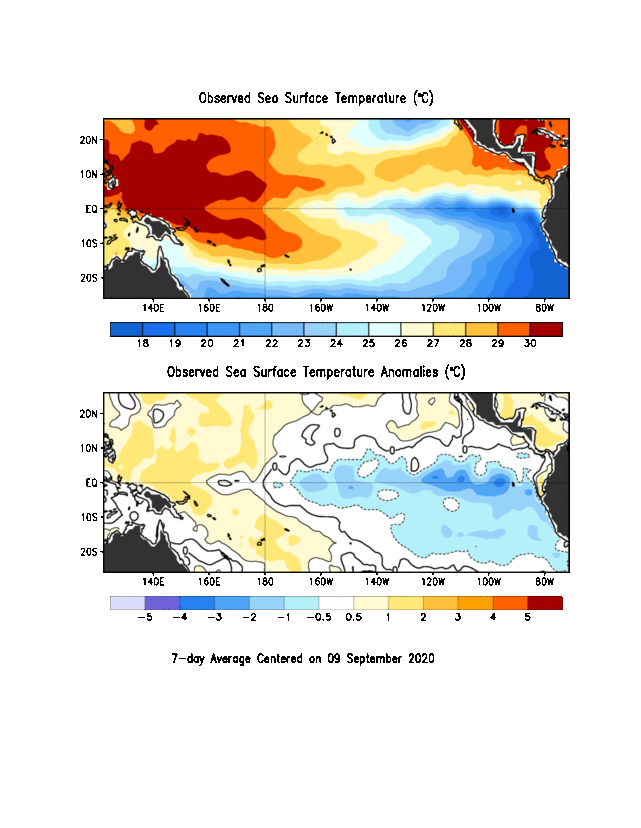
Models suggest La Nina persists through the winter, though CFS is stronger with it than other statistical models.

Will note that we are currently at -1.0, so a -0.5 forecast isn’t very useful. Thus leaning more towards the CFS

So what do historical La Nina winters look like - which years had them? 1988, 1995, 1998, 2005, 2007, 2010, 2016, 2017. Technically 1999, 2000, 2008 and 2011 did as well but they double dipped which is not our situation.

This is the overall all La Nina’s result in temps

This is just those that transition from an El Nino condition like this year.
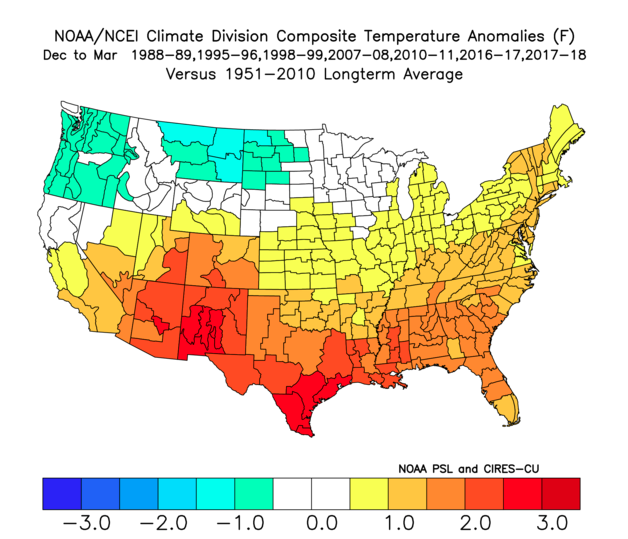
And these are the weaker La Nina years, -0.5 to -1.0 or so.

And precip…including weak years with double dip.vs coming from Nino

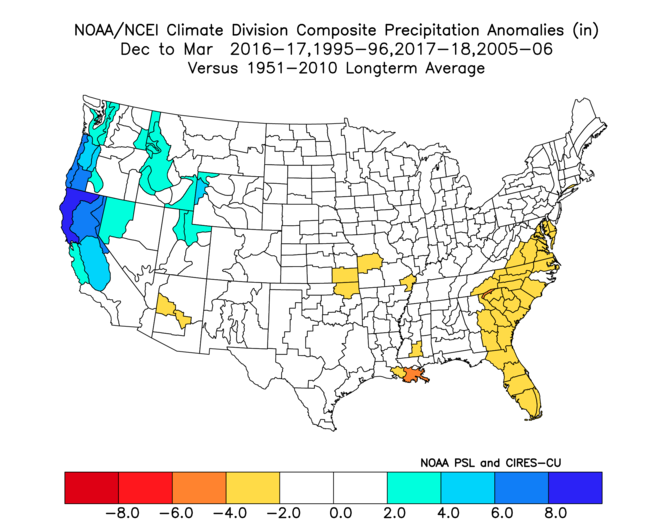
So the overall signal for the NE is warmer and average precip.
QBO is strongly correlated with winter conditions. QBO is the oscillation of easterly to westerly winds in the 10mb to 70mb layers (think 85,000 feet to 57,000 feet. Westerly values (positive) tend to lead to positive NAO and AO conditions, which favor warmer winters. Easterly (neg) have a weaker polar vortex and that can break free to dip deeper into the continents. This oscillation had been predictable until recently. Average negative phase was 15 months and positive 13. Negatives were usually stronger negative values than positives were positive. However, its 2020, and the recent negative only lasted 5 months and was very weak. So it will be hard to predict if it will be warm through the winter or not. My guess is yes. In looking back at the last 16 cycles that had a Jan-Feb in the positives, 8 were average, 7 were above normal and 1 was colder than normal. This is how they averaged out.

Pacific Decadal Oscillation
We’re in a moderately negative PDO now and there’s no indication that is about to change.

PDO years with-1 or greater anomalies are typically warm.
Arctic Oscillation
Last year, the AO single handedly kept us from getting cold. That and the weak -QBO, which are likely related. We went from 12-15ish through March without any negative AO and set new record highs. This is unheard of, but last year I noted there were 5 months of negative AO during lead up to the forecast.

This year its been a little less negative, but there were some days of being positive. I don’t have a good way to predict the AO. But its trending to be more volatile which is seasonal, and seems to have more ups and downs than last year. But if we are headed to a more positive trend, then we are definitely warm this winter. AO tends to be positive in westerly QBO years.

Eastern Pacific Oscillation.
Like the AO, not able to predict easily, but noteworthy that its positive for much of the time on the chart. Positive typically means warmer than normal in the East. But there was that big dump negative last week, which in turn gave us a cold snap here. Extrapolating out, with La Nina and neg PDO, I’m going to guess its a more positive EPO overall, with ups and downs. Those ups and downs may be enough to bring some snow.

Arctic Sea Ice
Looks like a near record year for lack of sea ice in the Arctic. 2012 is the only year its been less.

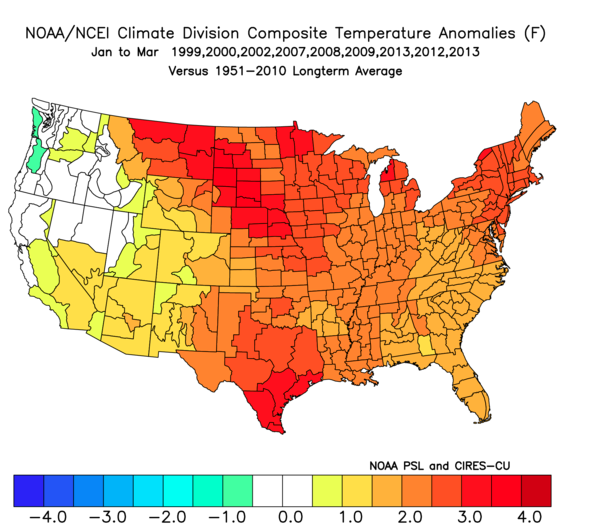
2012 winter looked like this temp wise. But I can’t hold much stock in sea ice extent as an indicator as then every winter this decade would be warm. 2012 was not a La Nina, was not +QBO, though it ties for the 4th worst hurricane season. Having those two in common and a PDO of around -1 I’ll add to my analog.

Solar minimums/maxima
We are currently 30 days with no sunspots and 76% of this year and 77% of last year had no sunspots. This is a deep solar minimum. But that doesn’t mean its going to be cold. Certainly not last year. This is the only signal for a cooler year, which we also had as a signal last year. So I’m not really counting on it much. 09-10, 95-96, 86-87 were all solar mins. 95-96 was a record setting winter here.

Hurricane Seasons
2020 was unprecedented in the number of hurricanes and toppled 2005’s record. 2005 was also a La Nina year but not a + QBO. 2005 also flipped from neg PDO to pos in Jan 06. 2012 was Neg PDO, 4th most hurricanes, and lowest sea ice. Other seasons with high hurricane counts are 1995, 2010 and 2011. 1933 was the third most, but can’t use going back that far. 2010 and 2011 were La Nina years, both - PDO.
This is what the most active hurricane seasons look like tempwise combined.

Current conditions
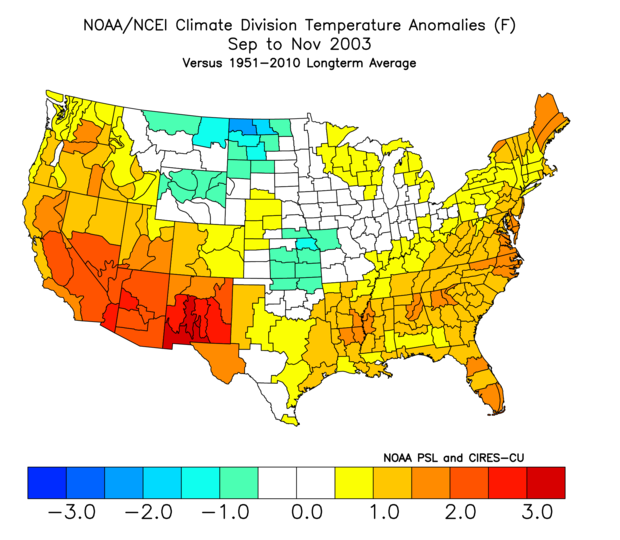
Looking at the current conditions for temps in the fall, the country was mostly warm with the upper plains being cooler than normal. You would think this would be fairly common as cold air masses start dipping down over the plains then head up through the Lakes.

However, there is only one other year going back 40 years with a temperature map even remotely close and that is 2003. 2003 also had a -PDO (weak though). QBO transitioned to positive in the following Feburary.
Summary
La Nina, active hurricane seasons, +QBOs, +PDOs all point to a warmer than average winter across the eastern ⅔ ‘s of the CONUS. This is the temperature analog for 1999, 2003, 2005, 2008, 2010, 2011, 2012 and 2018.
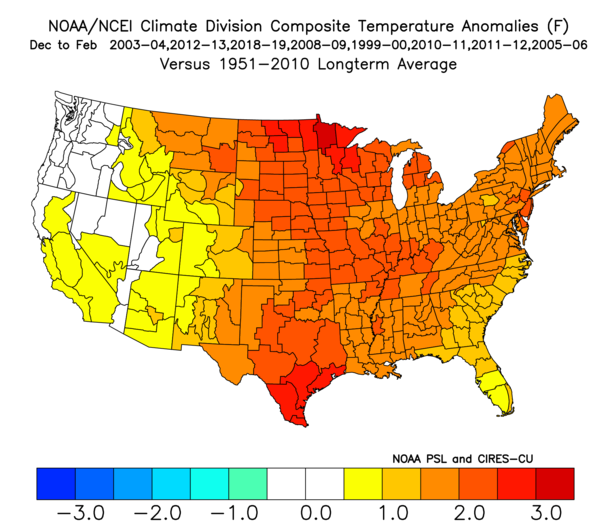
1999, 2008 and 2018 all were Ninas with +QBO. 2010, 2011, 2012 were active hurricane years with Ninas. 2003 was the only year that matched this fall’s temp profile. Solar min didn’t seem to apply last year so I skipped it. Sea ice extent matched 2012 and really anything this last decade so not heavily weighted. AO/EPO to hard to predict, though with a +QBO its assumed that AO will be more positive than negative.
So here is my temp forecast.
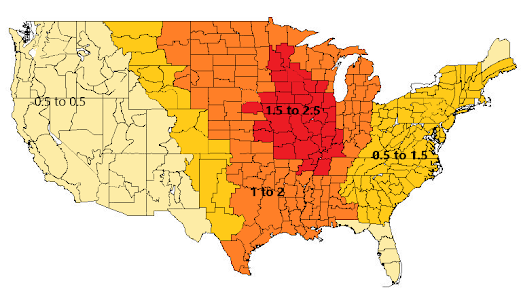
For precip it's wetter in the midwest, drier in the SE TX, AZ and Pac coast. Keep in mind that a +1.5 to 2 degree temp anomaly does not mean no snow, and perhaps could bring more if volatile. However, with a +AO favored as of now, I’m thinking we’ll have 70-80% of normal snow IMBY.
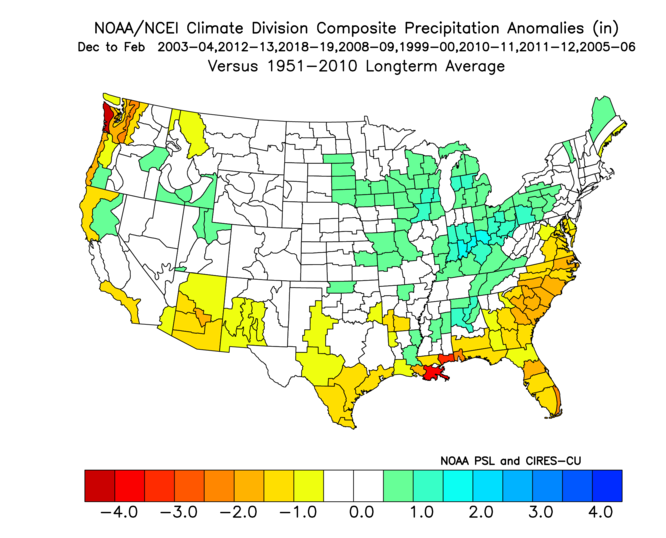
Here’s my precip map

The tricky part is snow. I don’t expect blowtorch temps, so if they are on average 2° above in the heavier precip areas, those may still be snow storms. Most of the country sees within 25% of normal snowfall. SE and W see less due to dry. TX, lower plains, mid atlantic less due to temps. Midwest sees more due to being in the volatile zone. NE likely sees less than normal, but one storm may change that.


.gif)
