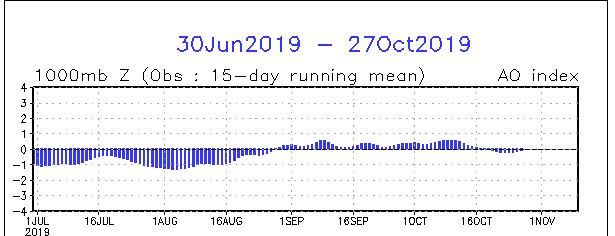
There were no analogs that showed up what actually ended up happening. The AO remained positive the entire winter, record breaking at times.
This is the result.
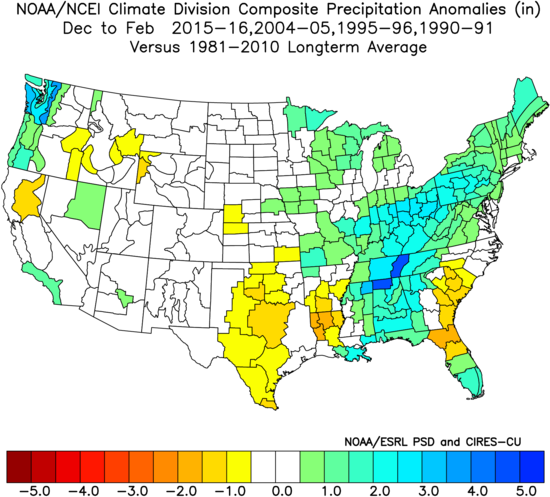
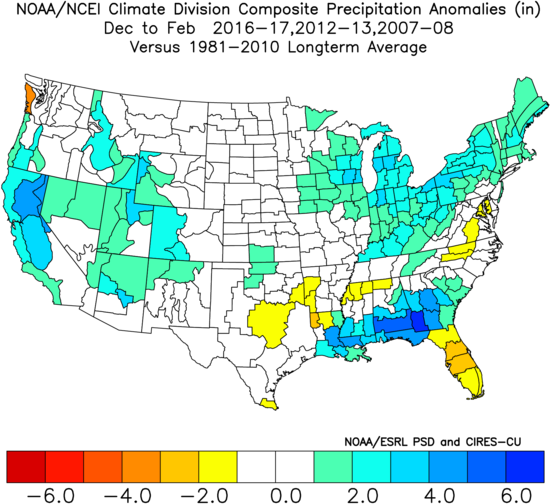
 Precip was a little closer. The drier and wetter parts seemed a little north, but not that poorly placed. I give myself a B on that. Missed the NW positive anomaly though.


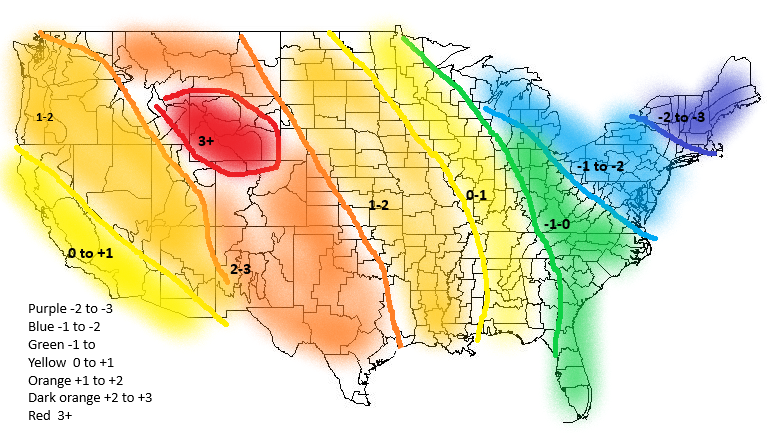
Second attempt at a winter forecast.
This is the result.


Second attempt at a winter forecast.
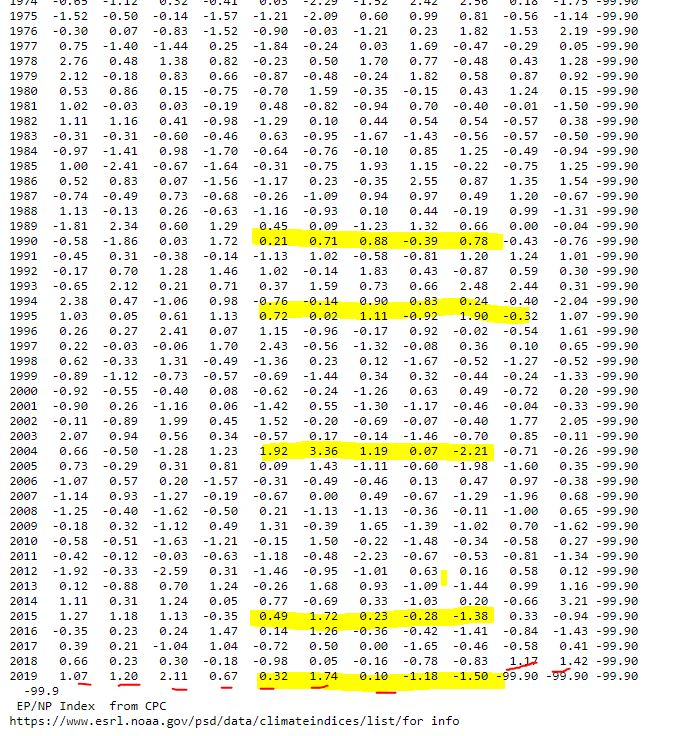
ONI
Current conditions


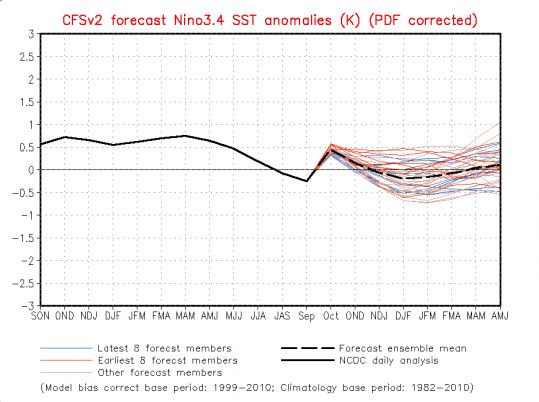
So ultimately I’m looking for a set that has us staying in the 0-0.5 range, coming from the 0.4-0.8 range. Not too many options. 1980 and 2003 are the closest. So then expand to neutral.
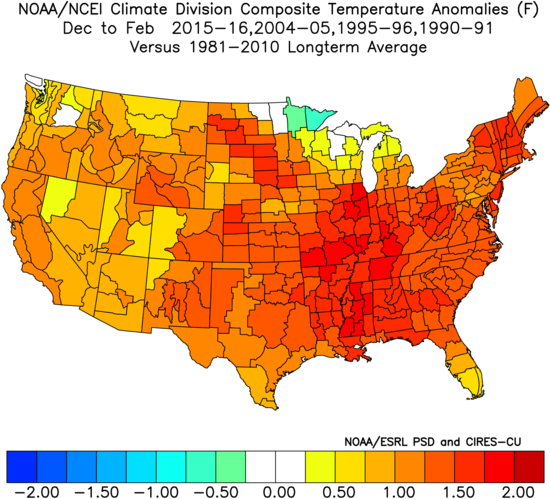
That result is a warm west cold east.

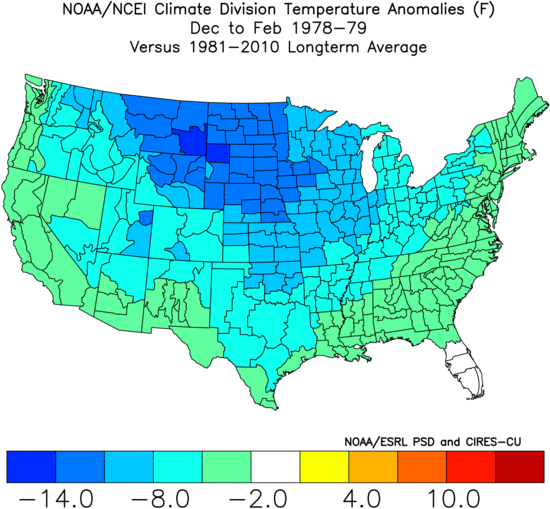
1978 was a bit lower than perfect.
1990 was a good match from the staying + side and the only warm analog

1993 as well

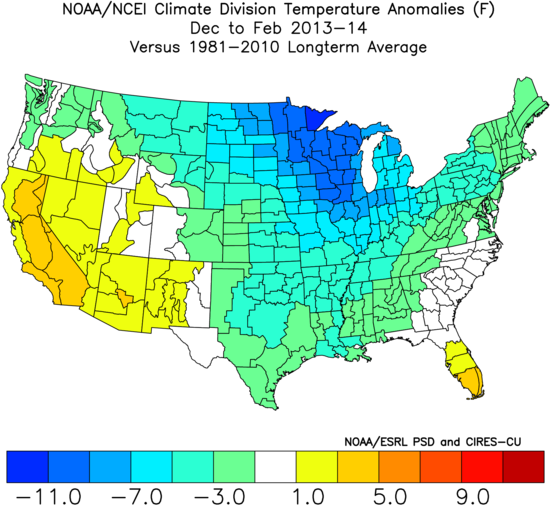
2013 was on the negative side.
2014 went from neg to weak nino in the winter.

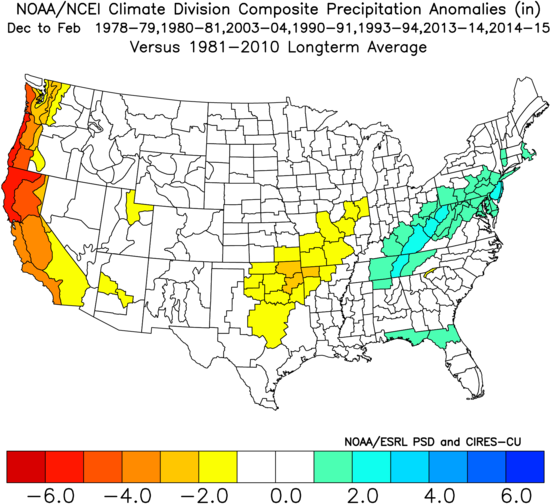
All up the ONI Analogs look like this from temp

And the Precip anomaly looks like
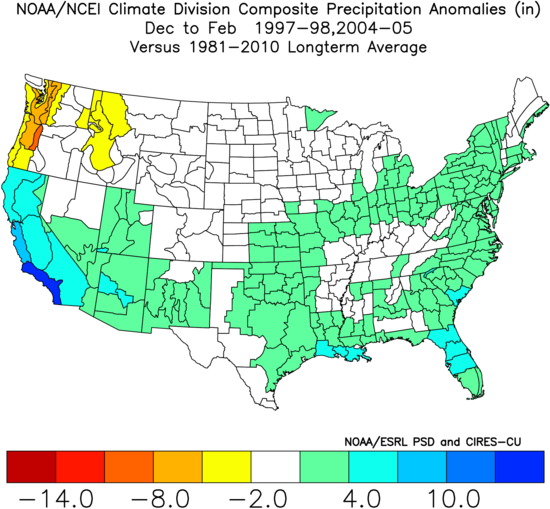
QBO
As discovered last year, the QBO has a pretty strong correlation. The challenge is finding the match. Last year I spotted a trend going to positive, which turned out correct, but was a fairly large assumption. The positive phase usually lasts 11-14 months, but… 2015 phase lasted 24 months. This year I’m guessing it goes negative, sometime in the JAN time frame. There are two years where this has happened. 97-98 and 04-05. Unfortunately neither lines up with the ONI and of course conflicts with ONI temp wise

PDO
The PDO has been fairly neutral historically speaking.

I’m going to end up with the same analogs as last year. I think it stays between -0.3 and +0.3.

AMO is pretty positive, moreso than last year, but its been positive for a while now, so not counting it much.

NAO is behaving as usual...so nothing to add with that, just normal cyclical activity.

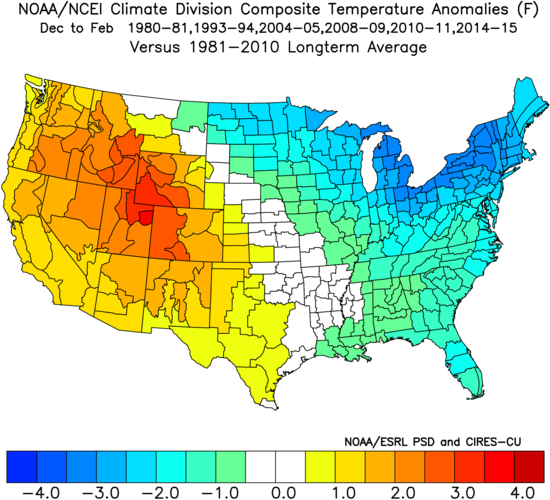
AO has had a string of 5 months negative, which is unusual. Happening only in 1980 (ONI year), 1993 (QBO year), 2014, 2010, 2008, 2004.


EPO is a challenge this year. It behaved oddly this year, stringing nine months of consecutive monthly positives.
I’m looking for periods in the second half of the year when it went from a string of + to neg. 1990, 1995, 2004 and 2015 match. Result is warmth CONUS wide..
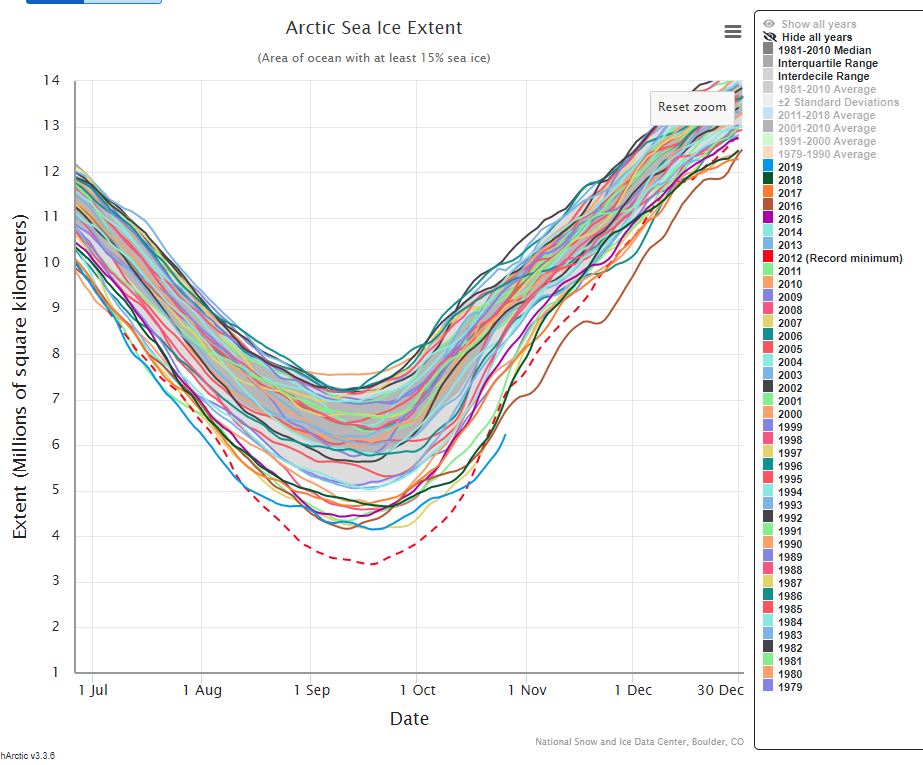
Sea Ice extent was the lowest in history earlier this year and right now (blue line). Closest comparisons are 2007, 2012 and 2016. These are all warm signals.
Similar years look like..

In looking at recent temp trend, I found the years 1980, 1984, 2000 and 2018 to be the closest Aug-Oct temp profile to this year.


That gives you the following temp profile for the following Dec-Feb

Summary - The following years showed up; 3x - 1980, 1993 and 2004. The following years showed up 2x 1990 and 2014. This is not a strong signal as last year I only counted 3x or more. So taking those years which show up 3x and 4x, its warm in the west, cold in the east and average precip mostly, slightly drier in the SE and NW.


In summary the following are colder than normal indicators for the NE: ONI, AO, PDO
The following are warmer than normal: QBO, EPO
I’m throwing out Sea Ice. I just don’t see a correlation there anymore as every year seems to be less and less.
I’m ignoring the NAO as its fluctuating normally, so its hard to analog against.
The AMO is warm, but that’s not unusual lately. However, it does factor into a slightly warmer temp forecast than analogged along the east.
This brings us back to 5 signals, three showing cold, two warm. QBO is normally reliable, but its hard to predict where it will be. EPO is coming off an unusually long positive phase and I can’t put much into where its going. ONI and PDO are pretty solid indicators, AO is unpredictable like the EPO and QBO. Thus I’m weighing ONI and PDO more heavily and the others more like 10%.
That results in the following maps.
Years used:
ONI: 80,03 (78,90,93,13,14)
AO: 80,93,04,08,10,14
EPO: 90,95,04,15
QBO: 97,04
PDO: 77,89,04,09,17
Aug-Oct Temps: 80,84,02,18


.gif)

No comments:
Post a Comment